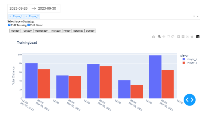
Raw numbers don’t always tell the full story. That’s where Tableau dashboards shine — transforming complex football data into interactive visuals that anyone can understand.
Why Tableau works in football analytics:
-
Interactive Exploration – Filter by team, player, or match instantly.
-
Clear Visuals – Heatmaps, passing networks, and xG charts make patterns easy to see.
-
Decision Support – Coaches, analysts, and fans can all make better judgments with visual context.
Practical Examples:
-
A player comparison dashboard to scout new talent.
-
A match analysis dashboard to review performance.
-
A season-long trends dashboard for tracking progress.
At Football and Analytics, we design ready-to-use Tableau dashboards that simplify football data so you can focus on strategy, not spreadsheets.
👉 With the right visuals, football data tells a winning story.


